Did you know that every time you load a website’s homepage, you’re adding to your carbon footprint? This is because websites rely on servers to power them – servers that are plugged into the mains and need electricity to run.
The slower the website is to load, the more power it uses, and the more carbon it produces. This is down to a number of factors including data transfer, energy intensity of web data, the energy source used and the carbon intensity of electricity.
We looked at 140 homepages of the most popular websites in the world to see which ones are the worst for the environment, as well as those who are doing their bit in the fight against climate change.
The top carbon creating homepages per visit
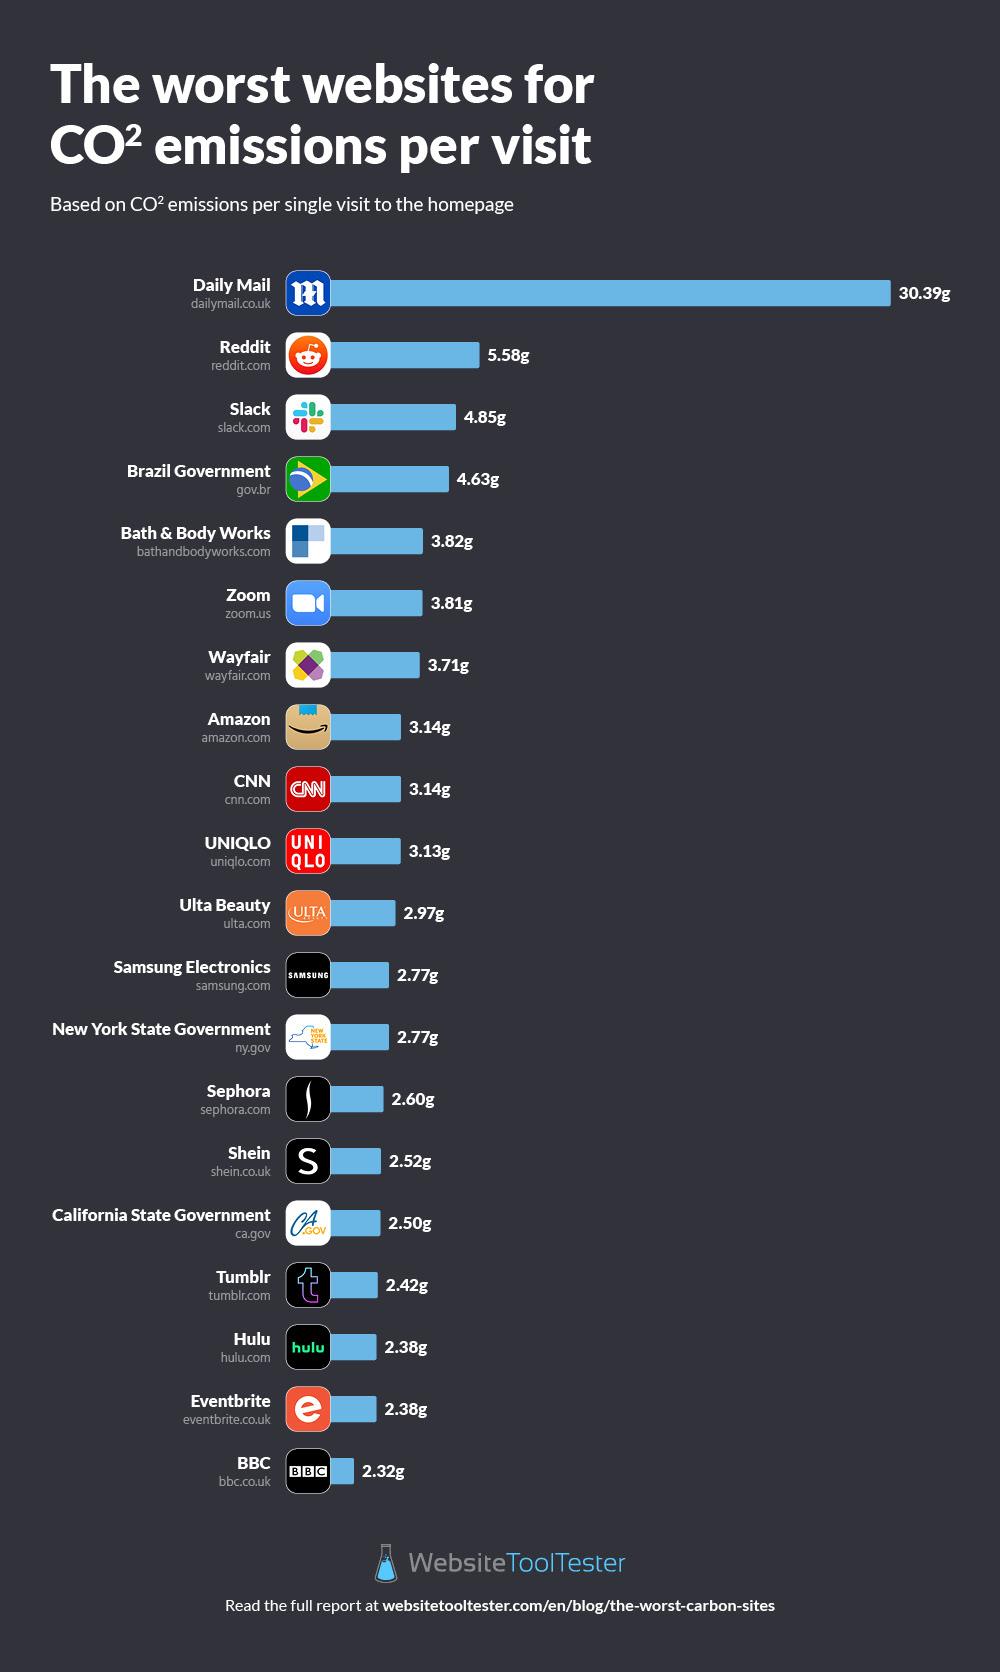
The Daily Mail produces more carbon than any other site per visit
Readers of The Daily Mail contribute more to carbon emissions than any other website, with the site using 30.39 grams of carbon every time someone loads the homepage. That’s over 20 million grams through homepage loads alone every year.
This is partly due to the amount of content on the site, which is regularly updated with breaking news and celebrity gossip, but also due to the time it takes to load. With 24.9 million visitors every month, the servers are constantly needing to reload and refresh new stories, causing it to run slowly and use up more energy.
The Daily Mail’s homepage is worse for the environment than 99% of other sites on the internet.
In second place, albeit a long way back, is Reddit. The forum emits 5.58 grams of carbon each time someone visits the homepage, or 103 billion a year. Reddit attracts an incredible 1.5 billion views every month, but its simple site structure helps limit its loading time.
Completing the top three is Slack. The workplace chat platform was designed to eliminate the need for email. The worrying thing is this high carbon output is for the homepage alone, and doesn’t take into consideration some of the app’s features that have become extremely popular with home working. The homepage produces 4.85 grams of carbon every time someone lands on it to log on.
The sites that care most about carbon
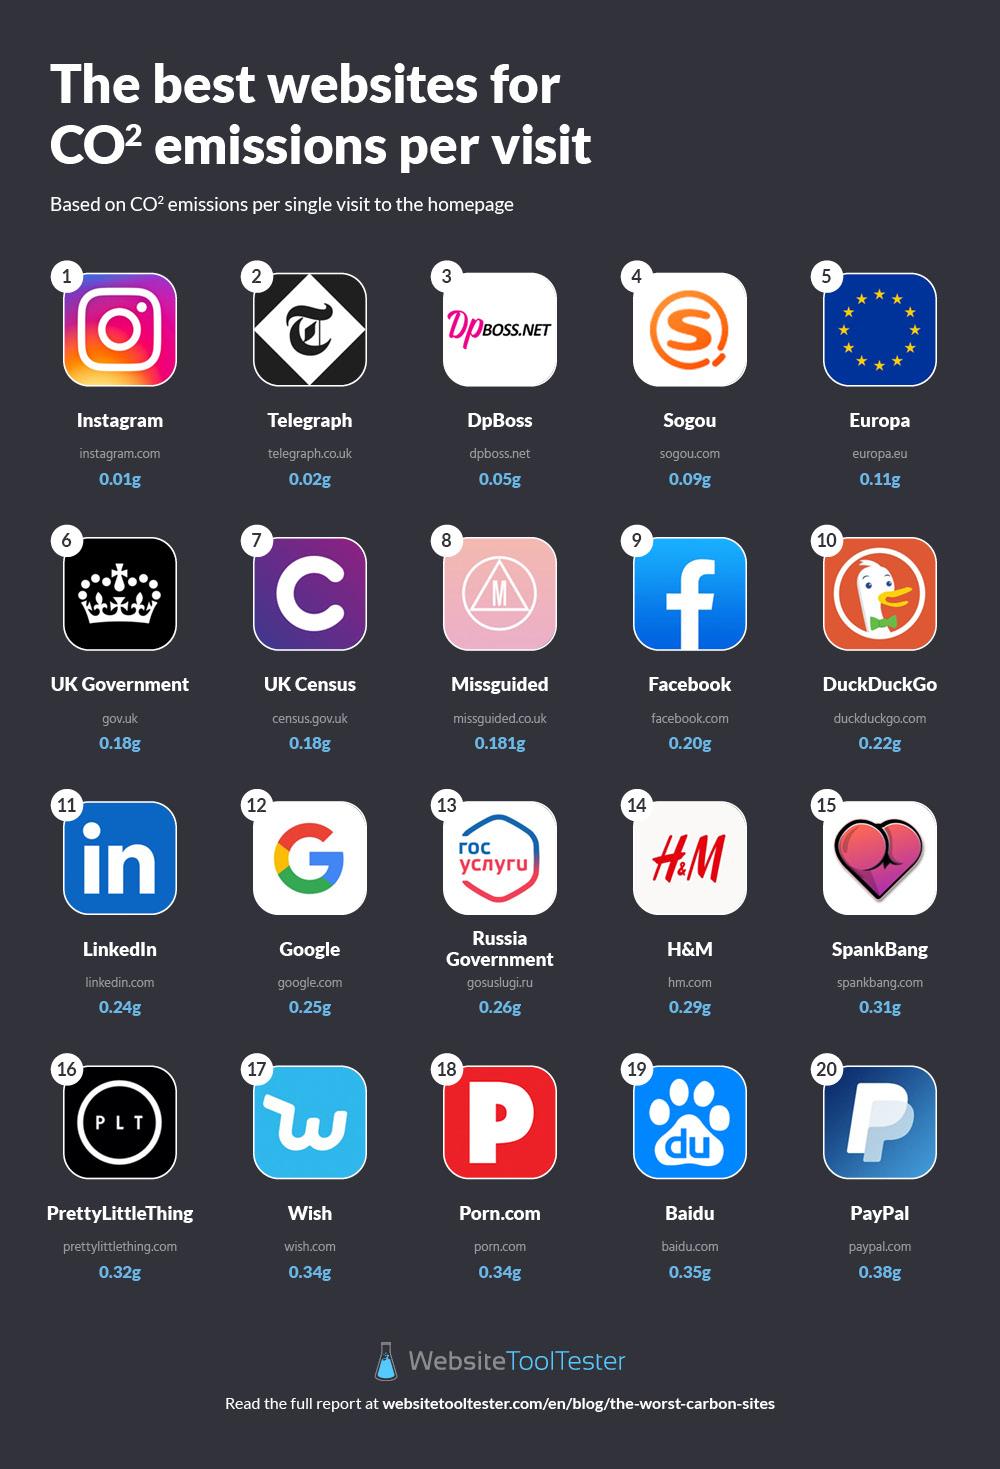
Instagram’s landing page is the cleanest online

Social media app Instagram is the cleanest homepage on our report. Thanks to its simple login before you move to the active news feed, the site produces only 0.01 grams of carbon every time a user logs in to their account.
This simple set up hugely differs from Instagram’s competitors. The Facebook login page releases 0.2 grams of carbon per login page visit, while Twitter users cause a whopping 0.84 grams every time they land on the homepage to login and tweet. This gives us an insight to how the overall sites are set up, with Instagram clearly taking the lead for the environment.
The Telegraph is another site that achieves good results. Despite hosting similar content to The Daily Mail, it manages to load it up for the cost of only 0.02 grams of carbon.
This is partly due to its clear layout. By using more text than pictures, the site loads faster across all web browsers, limiting any buffering.
In third place is a site you might not have heard of. DpBoss claims to be India’s number one Matka (a kind of lottery) site, and it only uses 0.05 grams of carbon when the homepage loads.
The sites that produce the most carbon annually
To calculate websites’ carbon footprint, we used their annual traffic and the CO2 produced per visit to the homepage. This allowed us to work out their yearly output, with some sites performing better than others.
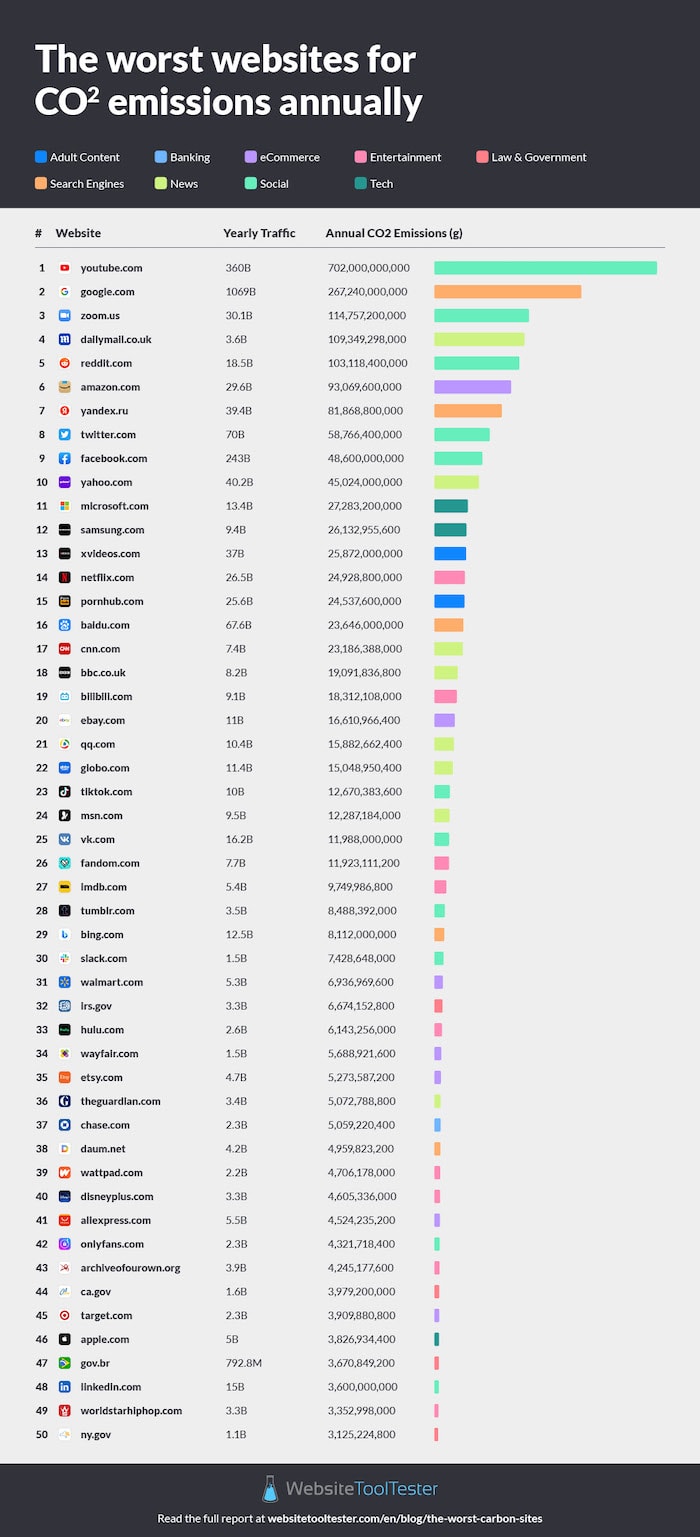
Netflix & Kill: The sites pumping out the most CO2 in a year

Thanks to its high number of users and data heavy content, Netflix creates an estimated 24.9 billion grams of carbon every year from its website visits alone. With a huge amount of shows on offer, and many of us fixed to our screens throughout lockdown, Netflix’s servers have been working harder than ever. What’s more worrying is the more people stream, the more carbon will be released.
However it’s YouTube, another video site, that takes the entertainment title. With millions of videos, live streams, music and more all being hosted, the site’s landing page creates 702 billion grams of carbon a year. Meanwhile Google – despite being one of the cleanest sites per visit – kicks out a huge 267 billion grams due to the huge amount of people who use it every day.
Even though it only has around one eighth of its users, The Daily Mail (109 billion) still scores a similar yearly total to Zoom (114 billion). That’s due to the Mail’s landing page being significantly larger, and therefore slower to load. Zoom’s site consists of a simple interface, making it fast to load and simple to power. Its high score is down to the surge in popularity it experienced during Covid-19.
The IRS is the least environmentally friendly government homepage
The IRS might not be your favourite service, but the arm of the US government responsible for collecting taxes is definitely the environment’s least favourite. The site kicks out over 6.6 billion grams of carbon every year, largely due to how complex the site is to navigate.
The more pages a user has to click through to complete an action, the more power the website needs to run. And it’s safe to say, if you go to the IRS site, there’s a lot of clicking waiting to be done.
Ca.gov, the official website for the state of California comes in second with 3.9 billion grams, beating competition from South American rival gov.br (the government website for Brazil) which creates 3.6 billion.
Amazon’s site is killing its namesake rainforest
It might be practical for your online shopping, but Amazon certainly isn’t great news for climate change. The retail giant produces more than 93 billion grams of carbon in a single year just from users visiting the homepage. The dizzying array of products and corresponding pages making it a mammoth of a site to navigate.
eBay is next in the world of retail, creating 16 billion grams of carbon, with Walmart someway back in third with 6.9 billion.
It looks like the highstreet isn’t the only thing being killed by online shopping.
Twitter’s homepage releases 58.7 billion grams of carbon a year
Our study found that Twitter has the worst homepage of all social media platforms for releasing carbon annually, scoring eight worst overall just for its simple login page. The site’s homepage alone releases 58.7 billion grams of carbon a year thanks to its 69.9 bn yearly traffic. Facebook, although having more yearly traffic at 243 billion, landed just behind in eighth thanks to its homepage’s (slightly) lower carbon emissions of 48.6bn a year.
LinkedIn wins the battle of the social apps when it comes to carbon emissions, with the professional networking site’s homepage only creating 3 billion grams of carbon a year. That’s less than Tumblr (8.4 billion) and TikTok (12.6 billion).
Every like requires power from somewhere.
How does this release of carbon compare?
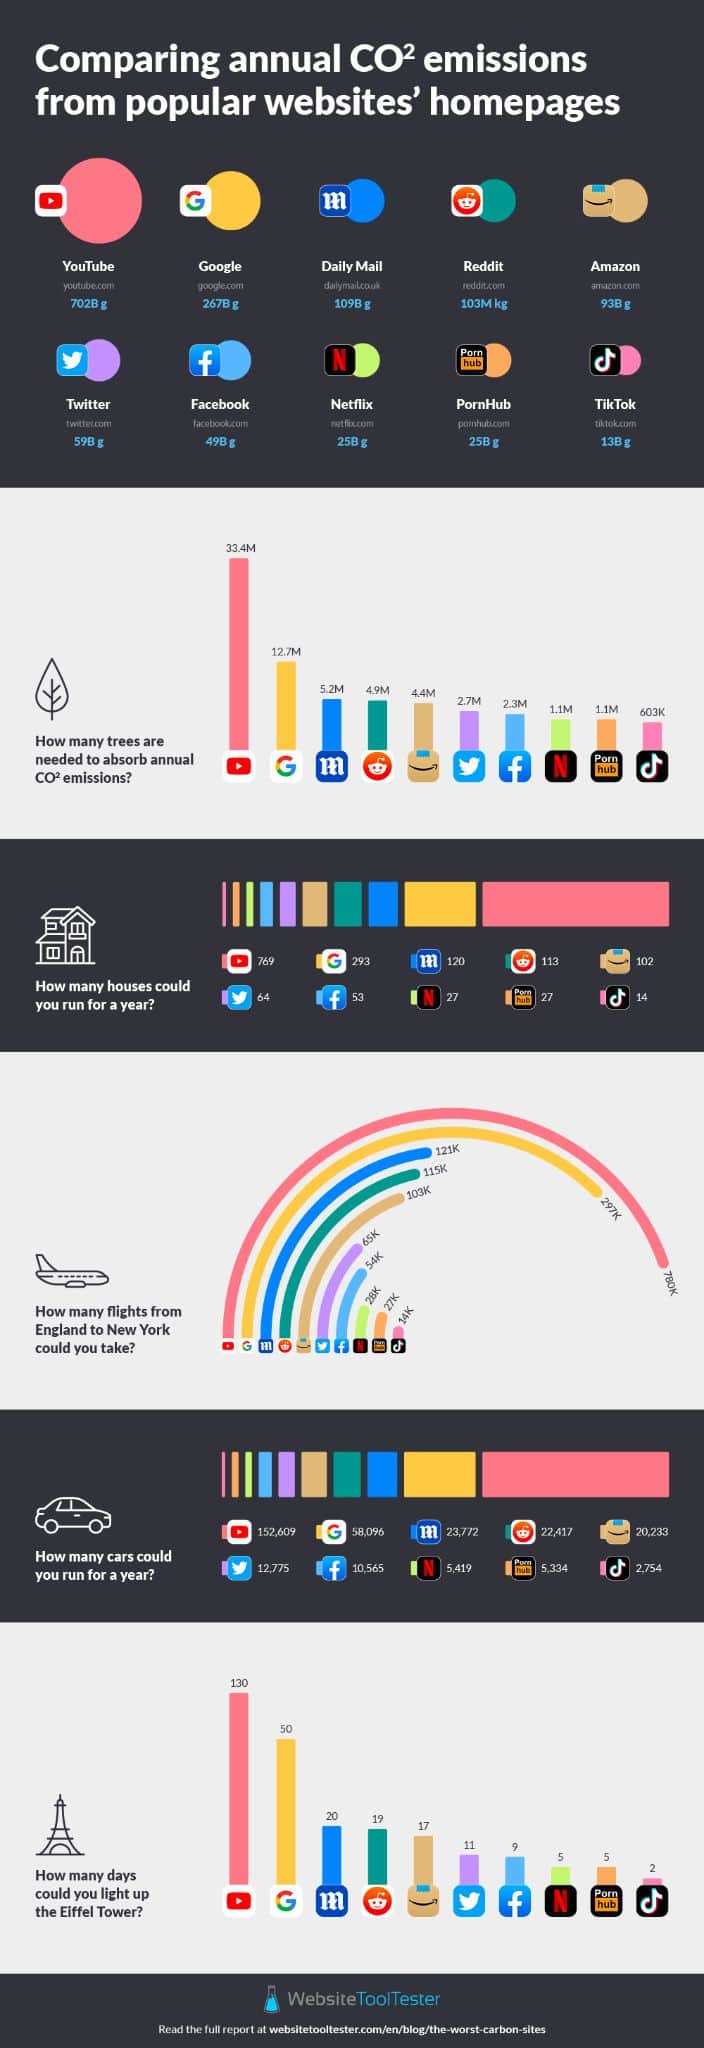
You could fly to New York 27 thousand times or watch porn for a year
PornHub, the adult entertainment site, creates 24.5 billion grams of carbon every year just from homepage visits alone. That’s almost as much as 27 thousand flights from London to New York, a trip that usually creates 900,000 grams of carbon.
Adult sites in general come out as, unsurprisingly, quite dirty. XVideos generates 2.5 billion grams of carbon a year, while YouPorn emits 2.9 billion.
With grainy videos and especially heavy content, it’s no surprise to see the x-rated amount of carbon they produce.
The five worst homepages for the environment in each sector
See how some of the biggest brands in business fare in our CO2 survey.
Banking
1. Chase: 5.05 billion grams of carbon a year
Chase’s site is full of security features to keep your money secure, but incredibly text heavy pages make it a slow loader.
2. Paypal: 2.5 billion grams of carbon a year
Paypal’s interface is simple, but their website contains a lot of content. The pages take their time to load, with detailed text adding to its score.
3. Wells Fargo: 1.9 billion grams of carbon a year
Another banking site that suffers for its secure backend. Wells Fargo keeps your money safe, but at what cost to the planet?
4. American Express: 1.3 billion grams of carbon a year
Express by name but slow by nature, American Express comes fourth in the list of bad-for-carbon banks.
5. Capital One: 1.3 billion grams of carbon a year
One of America’s biggest credit card companies is also one of its worst for carbon emissions.
Beauty
1. Ulta: 1.1 billion grams of carbon a year
The American beauty chain’s huge range of products make for ugly reading for the environment.
2. Sephora: 1.04 billion grams of carbon a year
France’s premier beauty brand again suffers for the huge amount of product pages online. More clicks, more carbon.
3. Bath & Body Works: 1 billion grams of carbon a year
The site includes lots of lovely product images, all of which substantially slow its loading time.
4. Beauty Hotpepper: 546 million grams of carbon a year
The Japanese beauty chain scores almost half the total of its beauty rivals for a more slimmed-down approach to product pages.
5. Boots: 382 million grams of carbon a year
Boots’ site is simple in its design, significantly reducing how much carbon it emits.
Ecommerce
1. Amazon: 93 billion grams of carbon a year
Amazon’s vast amount of product pages, descriptions, images and videos all make the site a monster to load up.
2. Ebay: 16 billion grams of carbon a year
Another ecommerce site whose range of items cause it to be a slow burner. Buy, sell, pump out CO2.
3, Walmart: 6.9 billion grams of carbon a year
America’s biggest supermarket creates the biggest carbon total for online food stores.
4. Wayfair: 5.6 billion grams of carbon a year
They’ve got just what you need, but sadly not what the ozone layer needs.
5. Etsy: 5.2 billion grams of carbon a year
With millions of photos being uploaded all the time and publicly added product descriptions, Etsy’s site struggles with content overload.
Entertainment
1. Netflix: 24.9 billion grams of carbon a year
Yep, you read that right. Netflix kicks out a huge amount of annual carbon from its homepage alone. We expect their carbon output to be even higher once you factor in the amount of video files it needs to store and stream.
2. BiliBili: 18.3 billion grams of carbon a year
The Chinese video sharing site is packed full of animations and cartoons all of which need a lot of power to keep them playing.
3. Fandom: 11.9 billion grams of carbon a year
The entertainment version of Wikipedia hosts tonnes of content and internal links, with users regularly getting lost in information wormholes that all need powering up.
4. IMDB: 9.7 billion grams of carbon a year
You can find every film and TV show that’s ever been made on IMDB, all things that depend on a server to keep them live.
5. hulu: 6.14 billion grams of carbon a year
Just like Netflix, hulu suffers for its craft of providing us all with entertainment.
Fashion
1. Trendyol: 2.86 billion grams of carbon a year
Turkey’s largest fashion retailer is also our largest producer of fashion carbon.
2. Shein: 2.84 billion grams of carbon a year
This fashion content overload hits you with images, text and many, many pop-ups the second you visit the site.
3. UNIQLO: 1.96 billion grams of carbon a year
Fashion sites all come with product images, and while that’s great for their customers, it’s not such good news for their servers.
4. GAP: 1.2 billion grams of carbon a year
A major fashion brand with a major carbon emissions issue.
5. NIKE: 1.14 billion grams of carbon a year
Their range of trainers alone would produce more carbon than most sites on the internet, probably.
Tech
1. Microsoft: 27.2 billion grams of carbon a year
One of technology’s founding fathers, with a site that could use some updating to help it run a little smoother.
2. Samsung Electronics: 26.1 billion grams of carbon a year
Apple’s biggest competition in the mobile market wipes the floor with them when it comes to this carbon competition.
3. Apple: 3.8 billion grams of carbon a year
Just like their products, slick and stylish is the name of the game online, helping Apple fall substantially below Samsung’s output.
4. Huawei: 1.4 billion grams of carbon a year
A simple content layout helps Huawei limit their CO2 output.
5. Lenovo: 1.2 billion grams of carbon a year
Another site that keeps it simple to reduce its CO2.
Tickets
1. Eventbrite: 990 million grams of carbon a year
The purpose for ticketing sites is basic, with limited information and a fast backend helping their carbon cause.
2. TicketMaster: 326 million grams of carbon a year
Most of TicketMaster’s technology sits behind the frontend, helping its site load faster and serve customers more efficiently.
3. SongKick: 95 million grams of carbon a year
A site that notifies you when tickets go on sale is pretty light when it comes to content.
4. Stubhub: 75 million grams of carbon a year
Text, pictures and not much else. Great news for page loading times and the environment.
5. AXS: 58 million grams of carbon a year
Another ticketing site that doesn’t overcomplicate things when it comes to web design.
How to make sure your site is energy efficient
To create a website that doesn’t contribute to climate change, you need to ensure your content loads fast and your user experience is optimised. The easier it is for your customers to find what they’re looking for, the less pages they’ll need to load, and the less power your site will require.
It’s also worth thinking about the power supplier your servers use. Switching to a greener alternative can be a quick way to cut back on carbon.
Finally, think about the data your site needs to load. Does every visitor need to see everything, or can some of it be loaded up later? Things like videos that play automatically use up lots of bandwidth, while product pages that self-populate are less energy efficient than filters.
One easy way to improve your site speed and reduce your carbon output is to reduce the size of the images on your website. Our free image compressor can help you bring down the amount of data that needs to be downloaded helping both your users and the environment.
We’ll help you find the perfect website building tool for your job, giving you full control over how everything works and how easy it is to access.
Will you be a carbon criminal or an eco warrior?
Methodology
Method:
To find which popular sites are causing the most CO2 we looked at sectors from a list of the world’s most popular sites; from fashion to social networking, pulling and comparing which are the most sustainable and which are creating the most CO2. To maintain a fair comparison we analysed the sites homepage only to show a representative number of how much carbon has been emitted.
Metrics examined:
- Traffic to website (monthly) using SimilarWeb
- Whether the website was dirtier or cleaner
- Amount of Co2 produced in grams per visit.
Figures were taken from https://www.websitecarbon.com/ which gathered various data such as:
- Data transfer over the wire
- Energy intensity of web data
- Energy source used by the data centre
- Carbon intensity of electricity
- Website traffic
From those 3 metrics we then gathered interesting stats to compare the co2 emissions based on 10 comparisons: (All based within yearly projections)
- Amount of trees absorbing Co2 (from website)
- Energy (KWH) produced within a year (from website)
- How many possible flights to New York from London Calculation: Website co2 in tons divided by co2 emitted per flight
- How many days could the Eiffel Tower be lit for. Calculation: Yearly energy (KWH) divided energy needed daily
- Weight of Eiffel Tower Calculation: Weight of Co2 in tons divided by weight of Eiffel tower
- UK household usage – Calculation: Yearly energy (KWH) divided by average household energy usage
- Charge iPhone 11 from 0% to 100% – Calculation: Yearly energy (KWH) divided by energy needed to charge an iPhone 11
- Run a plasma TV 34-37 inch – Calculation: Yearly energy (KWH) divided by energy needed to run a single plasma TV
THE BEHIND THE SCENES OF THIS BLOG
This article has been written and researched following a precise methodology.
Our methodology